In discrete manufacturing (the production of discrete items that can be easily counted), monitoring the performance of assets is key to understanding how efficient an operation is and avoiding downtime which can hurt the business's profitability.
OEE has become the de facto standard for measuring this performance, and while this is useful to explain to users what is happening in the factory, it doesn't help to explain why. By exploring the additional data available from machines, we can gain insights into the root causes of performance issues, helping to bridge this gap in understanding.
What is OEE?
OEE (Overall Equipment Effectiveness) is an industry-standard metric used to assess the performance of a given asset in discrete manufacturing. It compares the difference between the actual and optimal production rate of the asset, represented as a percentage of the planned production time:
OEE
=
(Good Count x Ideal Cycle Time)
Planned Production Time
The good count is the number of pieces made which are free of defects. The ideal cycle time is the fastest possible time to manufacture one piece and the planned production time is the total time the asset is scheduled for production.
If the asset only made perfect parts and operated as fast as possible without stopping, the OEE would be 100%. In practice a score of 100% would be impractical and unsustainable - assets require frequent maintenance to operate performantly and stoppages can be beneficial to prevent material wastage and excess production.
It's generally agreed that an OEE of 85% is considered world-class, and for many, this has become a long-term objective for their operation.
Benefits of OEE
- Benchmark against industry standards: Since OEE is such a widely used metric, manufacturers can compare their equipment's performance against industry benchmarks. This helps identify how competitive a factory is in terms of efficiency and output.
- Visualise the impact of operational adjustments: Tracking changes in OEE over time allows manufacturers to see how process changes and maintenance efforts affect overall efficiency. This can help foster a culture of continuous improvement within the organisation.
- Increase equipment ROI: By improving the effectiveness of equipment, manufacturers can maximise output, reduce downtime, and increase the return on their investment in machinery.
Limitations of OEE
- A single aggregated score can obscure trade-offs: OEE combines availability, performance, and quality into one score, which can diminish the importance of individual factors. For example, a slower process that yields consistently high-quality parts may be preferable for manufacturers with high material costs.
- OEE doesn't identify root causes: While OEE measures performance, it does not explain why an asset is underperforming. Manufacturers must rely on additional analysis to determine the specific reasons for downtime, speed loss, or defects.
- Slow reaction to real-time changes: Since OEE is the result of an aggregate over time, performance drops are not highlighted immediately. This can delay responses to issues that occur during a production shift and can obfuscate small, incremental losses until much later.
- Time-consuming if collected manually: Manually gathering and calculating OEE data can be a labour-intensive and time-consuming process, leading to further delays in identifying and addressing performance issues in real-time.
Overcoming Limitations With Machine Connectivity
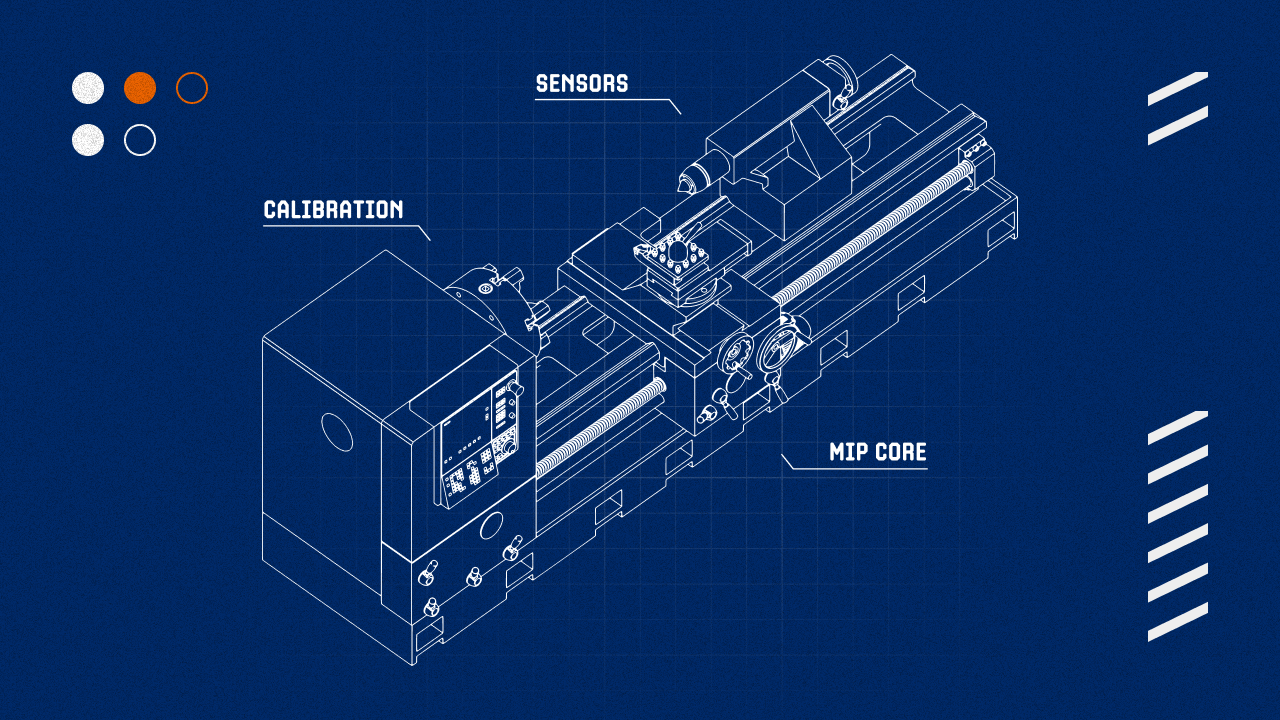
Modern manufacturing assets collect vast amounts of data, which is used by the onboard PLC (Programmable Logic Controller) to monitor ongoing operations, check asset health and generate reports. As well as recording basic information like part production and operating time, they are also capable of recording large amounts of data from onboard sensors; ranging from the axis coordinates of cutting lathes to coolant temperature.
The autonomous extraction of this information into external systems for analysis is known as machine connectivity.
This process allows manufacturers to collect a wealth of data in real-time, including sensor readings, maintenance logs and operator inputs. With this information, they can analyse this data in a more meaningful way, right as it happens. Instead of focusing solely on OEE, manufacturers can monitor specific process parameters, track deviations in real-time, and correlate these with production outcomes.
By extracting the information into a central location, similar assets can be compared to find anomalies and the results can be further augmented with operational data such as machine operators, part types and factory conditions.
This deep, granular data provides the context that’s often missing from OEE alone, helping to explain why an asset might be underperforming. More importantly, it enables real-time insights that allow for immediate action, so improvements can be executed on the spot rather than waiting for manually calculated OEE reports.
These insights can drive incremental improvements in processes, such as optimising maintenance schedules and refining performance expectations.
How MIP Can Help
Achieving machine connectivity can be a complex process: different assets and manufacturers use different communication protocols, which software developers must navigate to extract the required information. The resulting data often comes in multiple formats, which must be normalised before it can be effectively compared against the data from other assets.
Further steps are then needed to store the information and import any supplementary data from other sources.
Razor's Manufacturing Insights Platform (MIP) has several features to make this easier:
- Connectors for common machines: MIP Connect includes a comprehensive collection of ready-made connectors for the most common assets on the market, supporting seamless integration with various machine types and protocols. Examples include connectors for Heidenhain and Fanuc Focus, as well as common protocols like OPC-UA and MTConnect. Additionally, support is available for bespoke requirements, enabling integration with specialised or legacy equipment.
- Data normalisation by default: MIP automatically transforms data into a standard format as it’s loaded to ensure interactions are consistent across all connected assets.
- Contextualised OEE: We automate OEE calculations and contextualise them within a complete factory view; providing a richer understanding of your operations and presenting you with actionable insights rather than one-sided metrics.
- Real-Time Visibility: With configurable real-time dashboards into machine performance, immediate detection of drops in performance is highlighted.
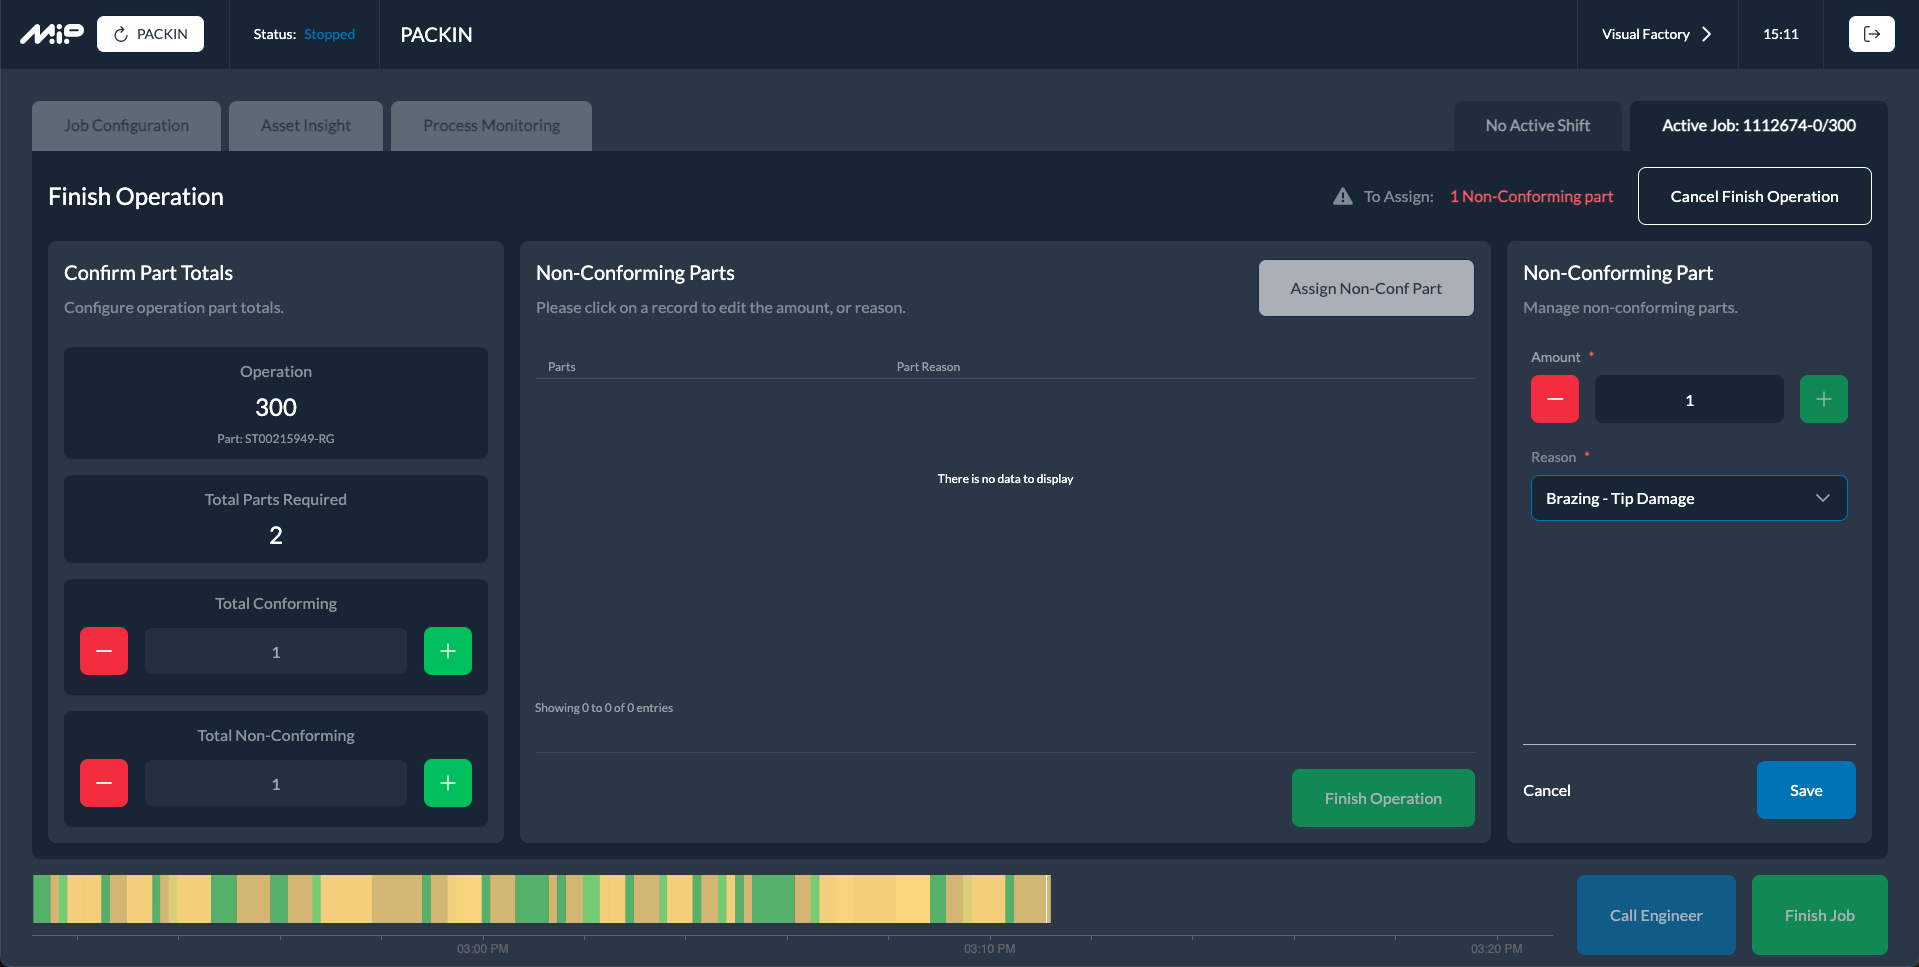
- Process Monitoring: The MIP operator dashboard provides real-time visibility into machine performance, allowing users to extract key insights. Visualisations can be configured to highlight the most important data points for your operation.
- Managed Storage: Normalised data is stored with future analysis in mind and can be cross-referenced with operational data from the management portal.
In Conclusion
OEE remains a valuable metric for gauging equipment effectiveness, but it's clear that true operational insights require more than surface-level data. By embracing machine connectivity, manufacturers can tap into the vast potential of real-time data, revealing the underlying causes of performance issues and enabling proactive decision-making.
Platforms like MIP simplify this process, offering a comprehensive solution that not only calculates OEE but contextualises it with detailed, real-time data. This holistic approach allows businesses to move beyond reactive measures, driving continuous improvement and fostering long-term, sustainable growth.
In a competitive manufacturing landscape, adopting this deeper level of data analysis is essential for staying ahead.